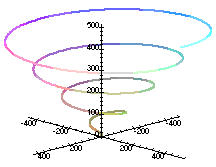
> x:=20*t*sin(t);
> y:=20*t*cos(t);
> z:=20*t;

                           x := 20 t sin(t)


                           y := 20 t cos(t)


                              z := 20 t

> with(plots):
> spacecurve([x,y,z],t=0..8*Pi,numpoints=1000,
>   axes='NORMAL',scaling='CONSTRAINED',
>   orientation=[45,75],thickness=2);