Leslie's Tower, With 3 Views:
View from the side:
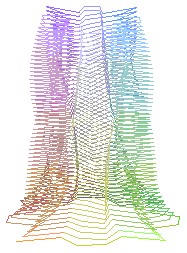
"Leslie's Tower," viewed from the side, was produced using
the following Maple commands:
> alpha:=1+1/2*cos(12*t);
> rho:=exp(-t/10/Pi);
> x:=rho*cos(t)+alpha*cos(t);
> y:=rho*sin(t)+alpha*sin(t);
> z:=t/2/Pi/10;

                      alpha := 1 + 1/2 cos(12 t)


                                          t
                       rho := exp(- 1/10 ----)
                                          Pi


                       t
      x := exp(- 1/10 ----) cos(t) + (1 + 1/2 cos(12 t)) cos(t)
                       Pi


                       t
      y := exp(- 1/10 ----) sin(t) + (1 + 1/2 cos(12 t)) sin(t)
                       Pi


                                       t
                            z := 1/20 ----
                                       Pi

> with(plots):
> spacecurve([x,y,z],t=0..100*Pi,numpoints=1000,
>   orientation=[45,75],scaling='CONSTRAINED');
Fly-by View:
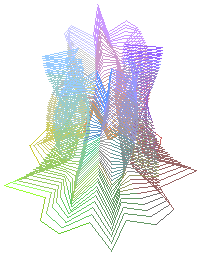
The "Fly-by View" was produced using:
> orientation=[175,40]
in the above Maple spacecurve command.
A View From the Top:
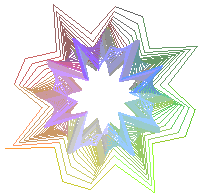
"A View From the Top" was produced using:
> orientation=[62,0]
in the above Maple spacecurve command.
SFU /
Math & Stats /
~hebron /
math252 /
assignments /
sol03 /
studentcurves /
leslie.html
Revised 11 Feburary 1999 by
John Hebron.