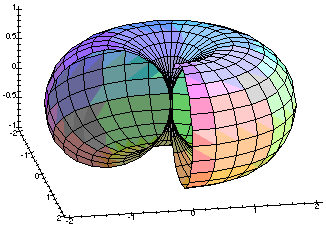
x:=(1+cos(theta))*cos(phi);
x := (1 + cos(theta)) cos(phi)
y:=(1+cos(theta))*sin(phi);
y := (1 + cos(theta)) sin(phi)
z:=sin(theta);
z := sin(theta)
  plot3d([x,y,z],theta=-Pi..Pi,phi=0..3*Pi/2,axes='FRAMED',
    scaling='CONSTRAINED',orientation=[-10,70],style='PATCH');
The resulting plot appears to the right. Only 3/4 of the surface
is plotted (by letting phi go from 0 to 3*Pi/2), in order to see
a cross section.
