Math 251 Lecture 18: Friday, October 22nd 1999.

Today, the directional derivative and gradient vector were introduced, which is the subject of section 12.6.

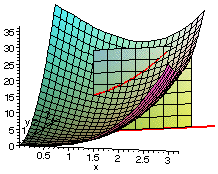
See the graph plotted at right. The green dot indicates the (x,y) coordinates of the point (in this case (1,2)), at which we wish to evaluate the directional derivative. The red line indicates the direction in which we wish to evaluate the derivative. A plane is drawn perpendicular to the red line, and this plane will meet the surface in a curve.

At right appears another view of the same graph. From this view, one can see the red curve on the surface, where the plane intersects it. The directional derivative is the slope of the tangent line to this curve.

A hand-drawn version of this graph was used in the scanned-in lecture notes, page 91.

(For those interested, the surface plotted is that of example 1, page 784 of the textbook.)
An expression for the directional derivative was obtained, and an example was worked out. The gradient vector was defined, and the gradient vector for the preceding example was obtained. It was then illustrated with Maple, which can be used to plot the gradient vectors along with the coutour lines of the function.


SFU / Math & Stats / ~hebron / math251 / lec_notes / lec18.html

Revised 26 October 1999 by John Hebron.