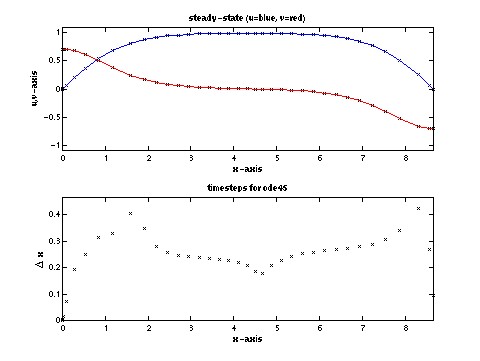

(Here is a sample descriptive paragraph.) The plot below shows a numerical computation of a steady-state solution to the diffusion with nonlinearity model (A=1.0, B=1.0, D=1.0). The blue curve is u(x) which vanishes at the endpoints, and the red curve is the derivative u'(x). The value of the initial derivative u'(0)=0.707 is just below the critical value 1/sqrt(2) where the period is infinite.
The jpeg figure below is obtained using the print command from within Matlab "print -djpeg90 -r60 lect02.jpg".


(Here is a sample descriptive paragraph.) The plot below shows a numerical computation of a steady-state solution to the diffusion with nonlinearity model (A=1.0, B=1.0, D=1.0). The blue curve is u(x) which vanishes at the endpoints, and the red curve is the derivative u'(x). The value of the initial derivative u'(0)=0.707 is just below the critial value 1/sqrt(2) where the period is infinite.
The jpeg figure below is obtained using the print command from within Matlab "print -djpeg90 -r60 lect02.jpg".

