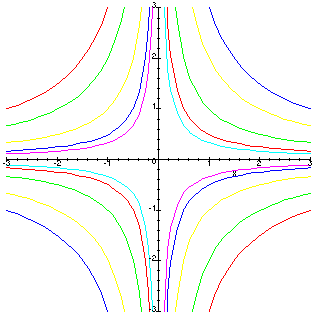

The Maple commands used to produce this plot are as follows:
  plot([-3/x,-2/x,-1/x,-1/2/x,-1/3/x,
        1/3/x,1/2/x,1/x,2/x,3/x],x=-3..3,-3..3);
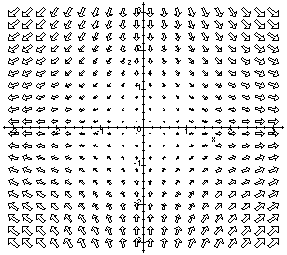
Here is a plot of the corresponding vector field, also asked for in question jh04.2:

The Maple commands used to produce this plot are as follows:
  with(plots):
  fieldplot([x,-z],x=-3..3,z=-3..3,arrows='THICK');
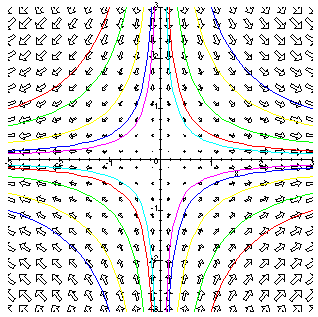
Here is what the two plots look like when put together on the same graph:

The Maple commands used to produce this plot are as follows:
  with(plots):
  plot1:=fieldplot([x,-z],x=-3..3,z=-3..3,arrows='THICK'):
  plot2:=plot([-3/x,-2/x,-1/x,-1/2/x,-1/3/x,
               1/3/x,1/2/x,1/x,2/x,3/x],x=-3..3,-3..3):
  display({plot1,plot2});