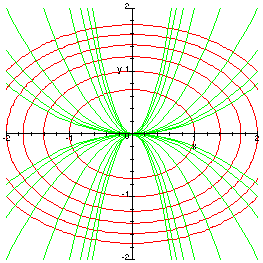

The Maple commands used to produce this plot are as follows:
  z:=exp(-x^2-2*y^2);
  plotlist:=[implicitplot({z=exp(-1),z=exp(-2),z=exp(-3),z=exp(-4),
    z=exp(-5),z=exp(-6)},x=-2..2,y=-2..2,grid=[40,40],
    scaling='CONSTRAINED')]:
  plotlist:=[op(plotlist),plot(x^2,x=-2..2,-2..2,color='GREEN'),
    plot(-x^2,x=-2..2,-2..2,color='GREEN')]:
  for i from 2 to 5 do
    plotp:=plot(i*x^2,x=-2..2,-2..2,color='GREEN'):
    plotmp:=plot(-i*x^2,x=-2..2,-2..2,color='GREEN'):
    plotm:=plot(1/i*x^2,x=-2..2,-2..2,color='GREEN'):
    plotmm:=plot(-1/i*x^2,x=-2..2,-2..2,color='GREEN'):
    plotlist:=[op(plotlist),plotp,plotm,plotmp,plotmm]:
  od:
  display(plotlist);